Comment
As we start the New Year, it is tempting to think that we’ve consigned the misery of the last twelve months to the past and can instead focus on a bright new investment horizon. Unfortunately, that’s rarely the case, and typically after a short respite, which we may have already had, the market is forced to face its old demons again. We believe this year is no exception. The good news is that a lot is discounted. The bad news is that the charts are now at pivotal levels. So, it won’t take much for last year’s trends to reassert and even markedly accelerate if reflexive forces kick into reverse.
Charts
A few months ago, we discussed how the sell-off, especially in Treasuries, had become extended and, for the first time in over two years, suggested buying the long end (“Are Bond Dynamics Finally Changing?” 26th Oct 2022). However, tactical trading aside, we also reiterated that driven by various factors, including fungibility via higher overseas yield, the US bond bull market of the last forty years is over (Virtual Road Show “Are We There Yet?” 20th Dec 2022). With that in mind, we want to flag what we believe is the linchpin chart of this whole piece, the Bund future. It has just held a 30-year trendline at around 132.60 or just under 2.6% in cash. As we discussed in the video, given our macro-outlook for the Eurozone, the ECB’s hawkishness, which is driving this current bond sell-off, looks appallingly timed. Hence, our first inclination is to buy the dip. However, if it breaks, the next obvious target is 120, which in cash terms is about 90bps higher, a move that would pressurise all sovereign yields.

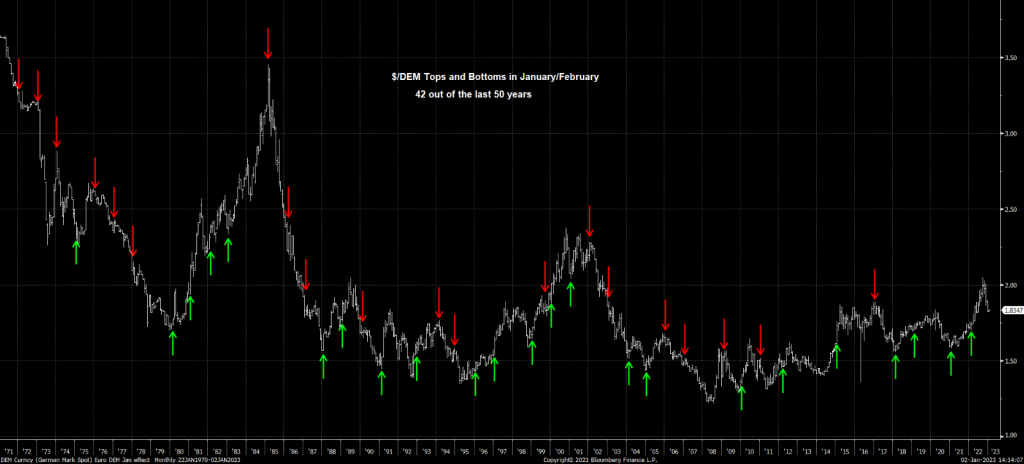
The implications won’t stop there because higher European yields will feed through into EURUSD, which is important because, since the end of Bretton Woods, over 80% of the time, the highs or lows of the year in the dollar vs European FX occur in January or February.
Perversely, our real concern isn’t bonds or FX but stocks. That’s because dollar strength sits at the epicentre of the market’s largest reflexive trade, which has seen foreigners fund a record US current account deficit via the un-FX-hedged purchase of US assets (“MI2 Chart Point: Gold & Silver as a Hedge” 14th Dec 2022). Therefore, the risk is that dollar weakness could trigger further repatriation of US equity holdings by European investors. Note that in Euro terms, US stocks are already relatively underperforming and breaking a decade-long channel.

To make matters worse, US indexes, with their focus on tech, are especially vulnerable to higher yields if Bunds were to extend the decline. Note, in echoes of our dot.com bubble analogy, the S&P vs the Information Technology GICS, which, having pinned its March 2000 high at the end of 2021, is now playing with critical support (“MI2 Chart Point: It’s Not Yet 2000 but…” 21st Feb 2022).

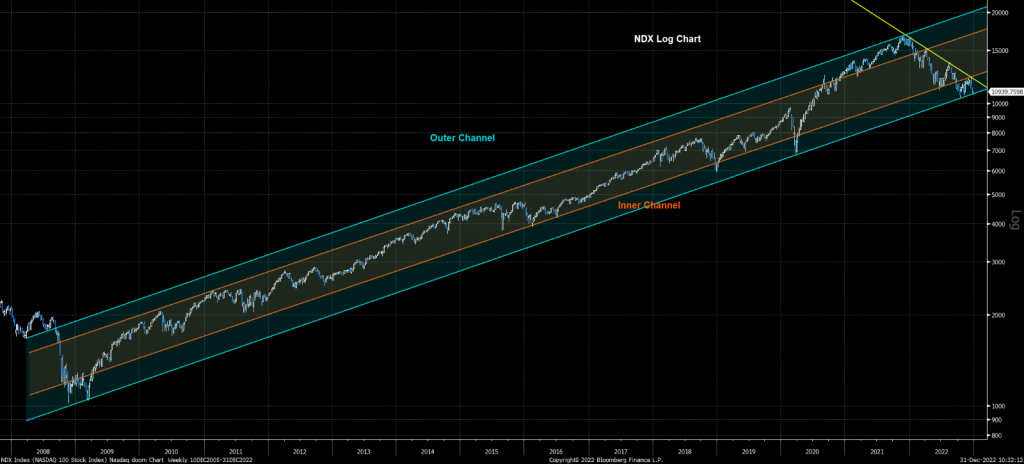
This risk is underpinned by the logarithmic chart of the NDX, which is currently flirting with the bottom of a multi-year weekly channel at around 10,750.
Bottom line, as you kick off the New Year, our presumption is that it’s just a matter of time before last year’s trends reassert and even accelerate if the virtuous reflexive forces that got us here turn vicious. It would be best if you had these charts on your radar.